Education and Public Outreach at EPIC - French School Visit
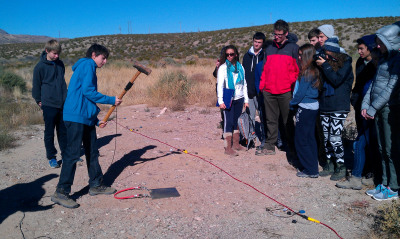
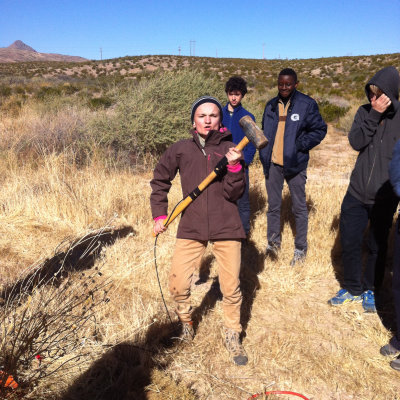 On Friday, November 1st 2013, a group of students and teachers from Bethesda, Maryland's Lycée Rochambeau/ French International School visited the EarthScope/EPIC facility on Socorro NM for some hands-on demonstrations of how seismic measurements are used to "see" geological strata underground. The class, led by instructor Marc Roux, head of the Biology and Geology Department, were assisted by EPIC scientists Greg Chavez and Michael Johnson during the deployment of a long string of geophones and a multi-channel data acquisition system. The students then used heavy hammers to produce active source tremors, and then were able to see the seismic responses in real time. The class assembled in the EPIC conference room to hear EPIC scientists/data specialists Dr. Wallis Hutton and KatyLiz Anderson discuss how such measurements can be used to find the depth of subsurface structures like the Moho. The visit was capped with a tour of the EPIC facility, led by scientist/software engineer Dave Thomas. (Photo: student Salomé Carcy; credit: Dr. Wallis Hutton)
Here follow some snapshots of the class's visit (photographs courtesy Marc Roux and Dave Thomas)
|
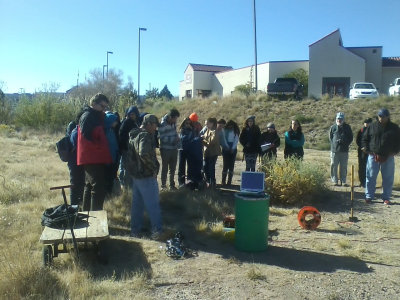
On the morning of the tour, the class gathered in front of the EarthScope/EPIC facility (shown in the background). |
 |
 |
Marc Roux (orange jacket) took notes, while Greg Chavez set up a multi-channel seismometer reading on the laptop. |
|
Greg briefed the class on the basics of this portable seismometer system. |
 |
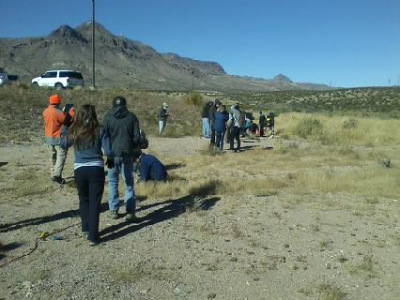 |
The students then helped to deploy an over-100-meter-long train of geophones across the desert near EPIC. |
|
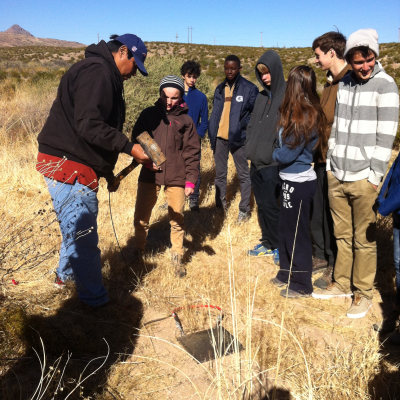
EPIC's Michael Johnson instructed the students on proper hammer techniques. Photo credit: Dr. Wallis Hutton |
 |
 |
This photograph shows one of the students delivering a mighty blow to the plate. |
|
Since measurements were made for several different locations of the hammer/plate assembly, several of the students were able to participate. |
 |
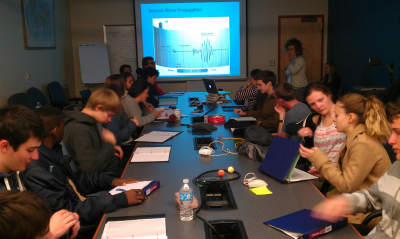 |
In the EPIC conference room, data specialists Dr. Wallis Hutton and KatyLiz Anderson lectured the students on how seismic reflection and refraction measurements are used to map out subsurface features like the Moho. |
|
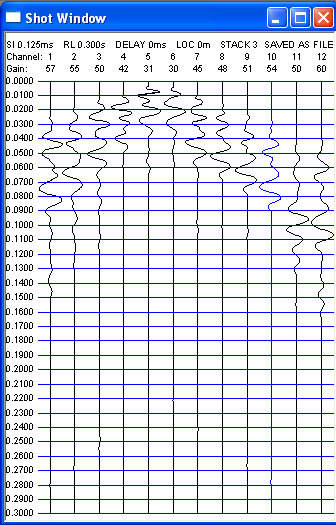
This graph shows the response of the multi-channel system to one of the hammer blows. Here, the hammer was struck near the center of the geophone string, and the impulses farthest from the center took the longest to arrive.
Here, the vertical axis is time in seconds, and the horizontal axis represents locations along the line at approximately 3m apart. |
 |
To learn more about seismic reflection profiling, consult the article "A historical reflection on reflections" by Bill Dragoset, which appeared in the the Society of Exploration Geophysicists' journal The Leading Edge.
doi: 10.1190/1.2112392
v. 24 no. Supplement
p. S46-S71
- Home
- General Information
- Instrumentation
- Dataloggers
- Sensors
- All-In-One Systems
- Power Systems
- Field Procedures
- Controlled Sources
- Seismic Source Facility
- Magnetotelluric Systems at EPIC
- Ground Penetrating Radar
- GNSS/GPS Receivers
- Power and Memory Calculations Form
- Data Archiving
- Apply for a PI Account
- Experiment Scheduling
- Polar
- Hardware & Software Notes
- Software

